
Tree View#
The Tree Representation offers a structured view of the experiment.
Experiment Tree View#
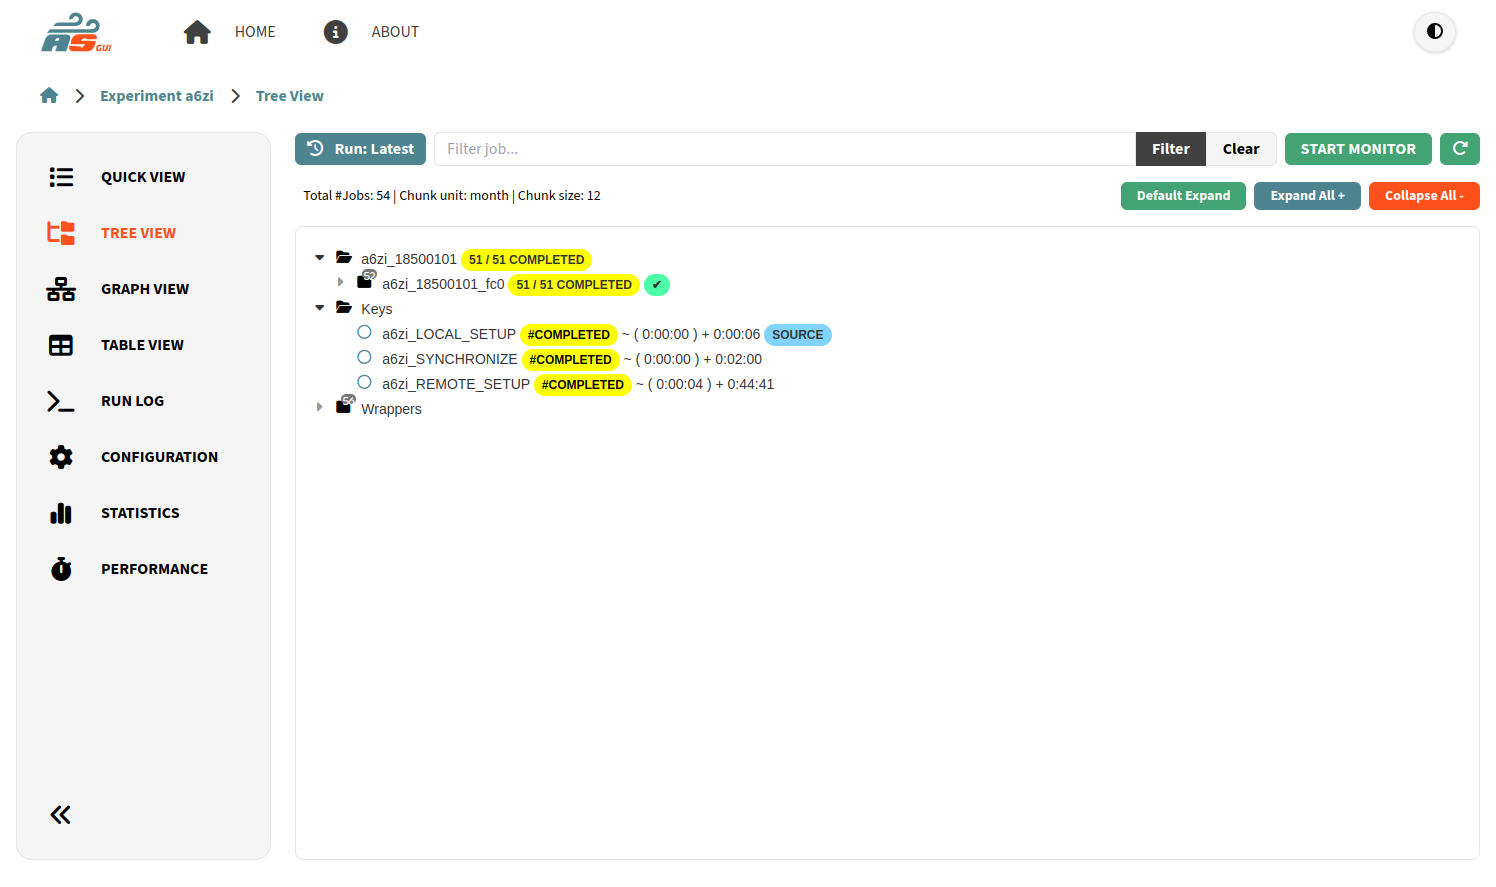
The view is organized in groups by date, and date-member. Each group has a folder icon, and next to the icon you can find the progress of the group as completed / total jobs (when all the jobs in a group have been completed, a check symbol will appear); then, an indicator of how many jobs inside that group are RUNNING, QUEUING, or have FAILED.
Furthermore, if wrappers exist in the experiment, these will be enclosed in the wrappers folder sorted by running time. independent groups will be added for each wrapper that will contain the list of jobs included in the corresponding wrapper. This implies that a job can be repeated: once inside its date-member group and once in its wrapper group.
Inside each group you will find the list of jobs that belong to that group. The jobs are shown following this format: job name + # job status + ( + queuing time + ) + running time. Additionally, each job can have multiple badges to describe them:
Jobs that belong to a wrapper have also a badge with the code of the wrapper
Jobs without children dependencies will have a
TARGETbadgeJobs without parents dependencies will have a
SOURCEbadgeJobs that belongs to a date but not to a member will have a
SYNCbadgeIf there are inconsistencies in the status of the job between their different sources (local/remote), a
SUSPICIOUSbadge will be displayed
The date-member folders will be displayed collapsed if all jobs inside a given folder have status COMPLETED, SUSPENDED or WAITING.
The user also can expand and collapse all the items of the tree by clicking the corresponding buttons located in the toolbar above.
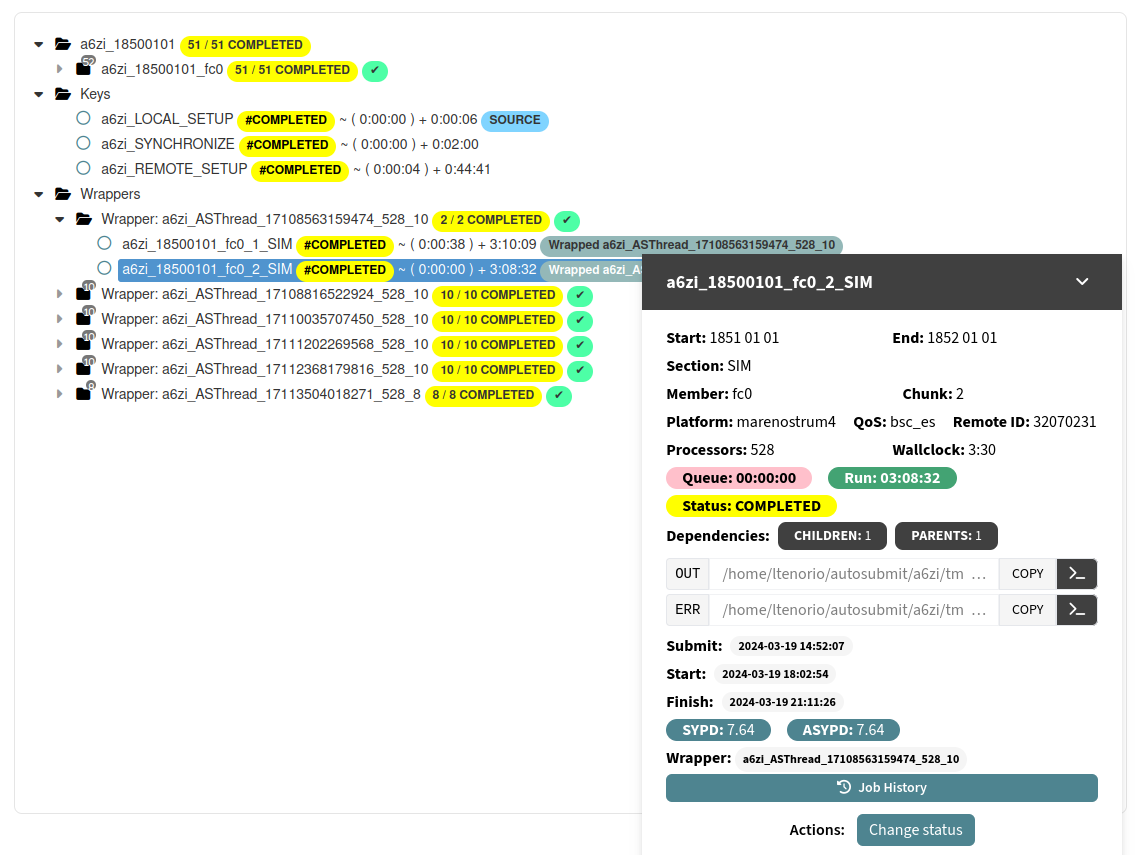
When you click on an item, you can see collapsible bottom Job Panel appear. You can expand/collapse it by double clicking its header or clicking the angle up/down button.
Note
Additionally, you can select many jobs at the same time by maintaining CTRL pressed and clicking on the jobs.
Experiment Panel#
Job Panel#
The Experiment Job Panel have the following information:
Start: Starting date.
End: Ending date.
Section: Also known as job type.
Member
Chunk
Platform: Remote platform.
Remote Id: Id in the remote platform.
QoS
Processors: Number of processors required by the job.
Wallclock: Time requested by the job.
Queue: Time spent in queue, in minutes.
Run: Time spent running, in minutes.
Status: Job status.
Children: Button that opens a list of jobs that depend on the one selected.
Parents: Button that opens a list of jobs on which the selected job depends.
out path: Path to the .out log file.
err path: Path to the .err log file.
Submit: Submit time of the job (If applicable).
Start: Start time of the job (If applicable).
Finish: Finish time of the job (If applicable).
SYPD
ASYPD
Wrapper
Note
Next to the out and err paths, you see the a Copy out/err button that copies the path to your clipboard. Then you see a >_ button, that when clicked will show that last 150 lines of the out/err file.
Additionally, you have an option to see the Job History and Change Status, if applicable.
If you click Change Status, you will be presented with the option to generate a change status command that can be run on autosubmit, or to generate the content of a change status file that can be used to change the status of the job.
Monitoring#
If applicable, you will see at the top right corner the button START MONITOR. When you click on it, a background process will be initialized and the data of the jobs will be refreshed every certain amount of time. Any change will be updated in the tree.
You can stop this process by clicking on the button STOP MONITOR.
Filter#
At the top left you can find the Filter text input box. Insert any substring and the list will show only those jobs whose description coincides with that string.
For example, #COMPLETED will show only completed jobs, Wrapped will show only those jobs that belong to a wrapper, _fc0_ will show only those jobs that belong to the fc0 member. Press Clear to reset the filter.
Down the search bar, you will see the total number of jobs, and the chunk unit used in the experiment.
Note
This view is designed to show a structured view of your experiment, if you want a more dependency oriented view that shows better the execution sequence of your jobs, you can refer to Graph View.