
Graph View#
The Experiment Graph View provides a dependency oriented view where a node represents a job and an edge represents a directed dependency relationship between jobs.
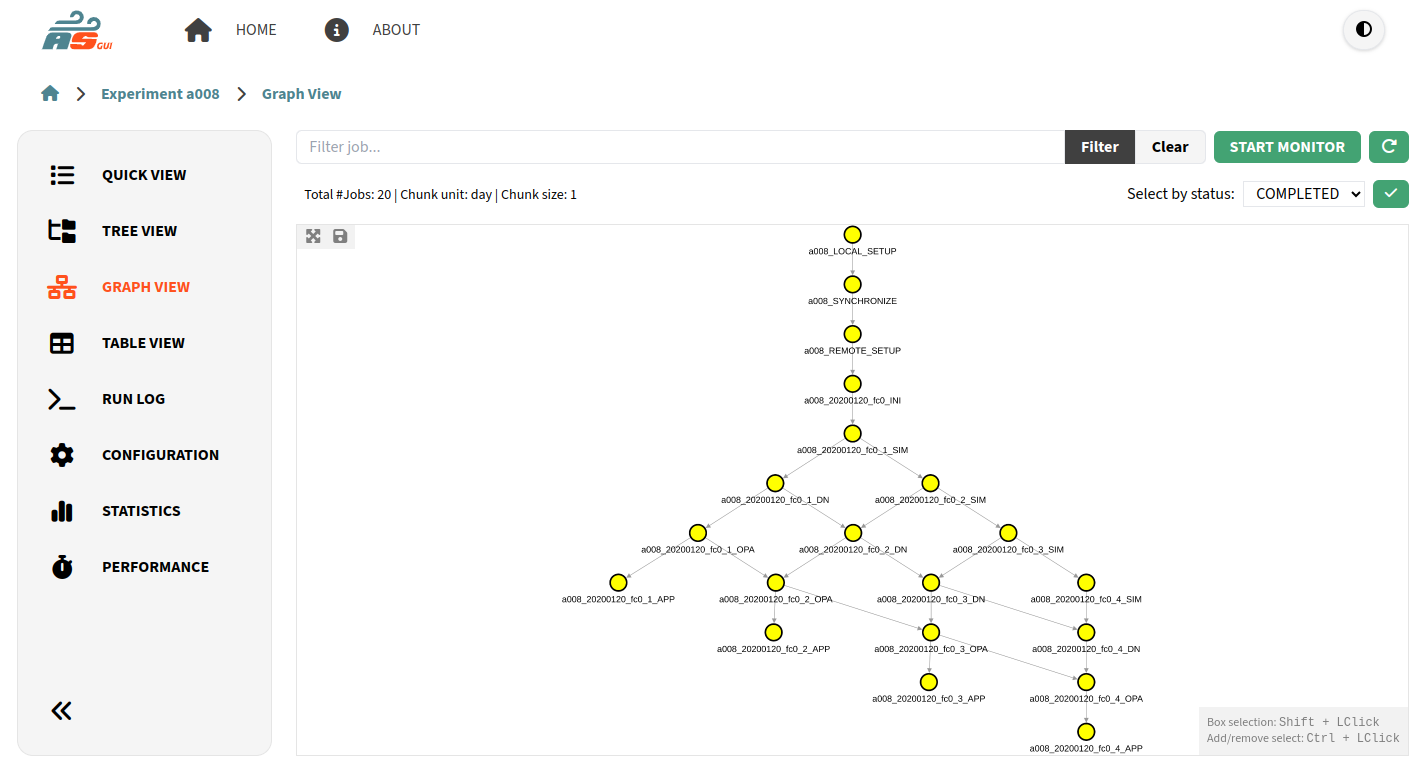
Experiment Graph View#
Graph Viewport#
The color of each node represents its status and below of each node you can see its job name. You can also use your mouse or trackpad to navigate the graph viewport, zoom in or zoom out.
On the top left part of the viewport, you have an option to fit all the graph elements in the viewport or save the current view as a PNG format image.
Note
For some experiments you will get a well distributed and generally good looking graph representation, for others you get a more straightforward representation. It depends on the size and dependency complexity of your experiments, not all experiments can be modeled as a good looking graph in reasonable time.
You can select many nodes at the same time by maintaining Shift or Ctrl pressed with Click, and dragging on the viewport. You can add or remove individual nodes as well by doing Shift or Ctrl plus Click one node.
When you click on a node, you can see collapsible bottom Job Panel appear. You can expand/collapse it by double clicking its header or clicking the angle up/down button.
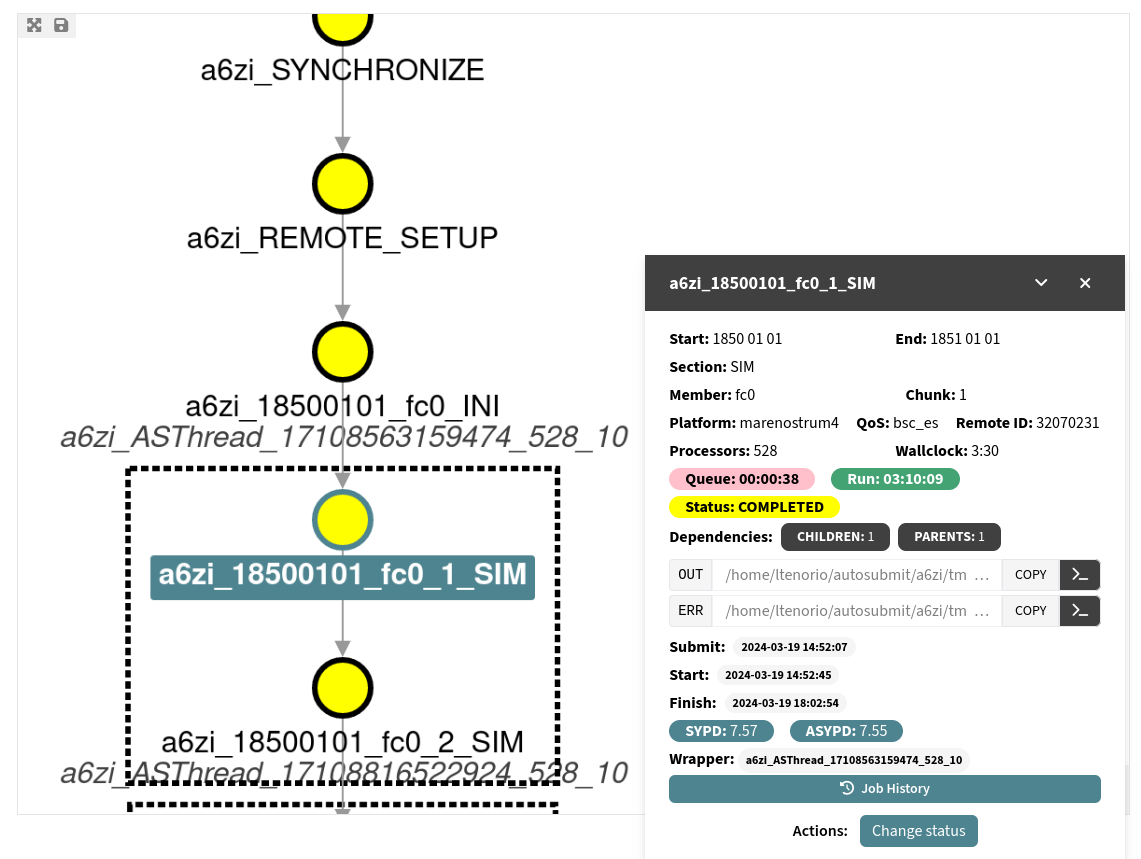
Experiment Graph Panel#
Job Panel#
The Experiment Job Panel have the following information:
Start: Starting date.
End: Ending date.
Section: Also known as job type.
Member
Chunk
Platform: Remote platform.
Remote Id: Id in the remote platform.
QoS
Processors: Number of processors required by the job.
Wallclock: Time requested by the job.
Queue: Time spent in queue, in minutes.
Run: Time spent running, in minutes.
Status: Job status.
Children: Button that opens a list of jobs that depend on the one selected.
Parents: Button that opens a list of jobs on which the selected job depends.
out path: Path to the .out log file.
err path: Path to the .err log file.
Submit: Submit time of the job (If applicable).
Start: Start time of the job (If applicable).
Finish: Finish time of the job (If applicable).
SYPD
ASYPD
Wrapper
Note
Next to the out and err paths, you see the a Copy out/err button that copies the path to your clipboard. Then you see a >_ button, that when clicked will show that last 150 lines of the out/err file.
Additionally, you have an option to see the Job History and Change Status, if applicable.
If you click Change Status, you will be presented with the option to generate a change status command that can be run on autosubmit, or to generate the content of a change status file that can be used to change the status of the job.
Monitoring#
If applicable, you will see at the top right corner the button START MONITOR. When you click on it, a background process will be initialized and the data of the jobs will be refreshed every certain amount of time. Any change will be updated in the graph.
You can stop this process by clicking on the button STOP MONITOR.
Note
While this is a good option to monitor the progress of your experiment, you can also use the Run Log as an alternative.
Job Search#
On top of the graph you will see an input text box following by the button Search. You can type a substring to search among the name of all the nodes. Once Search button is clicked or pressed Enter, all the match nodes will be selected.
Additionally, you can select by status on the top right side. This will select all the nodes the match a certain status.
Wrappers Representation#
Wrappers are an important feature of Autosubmit, and as such, it should be possible to visualize them in the graph representation. They are represented as a rectangular box with dashed border that will wrap the jobs inside it.
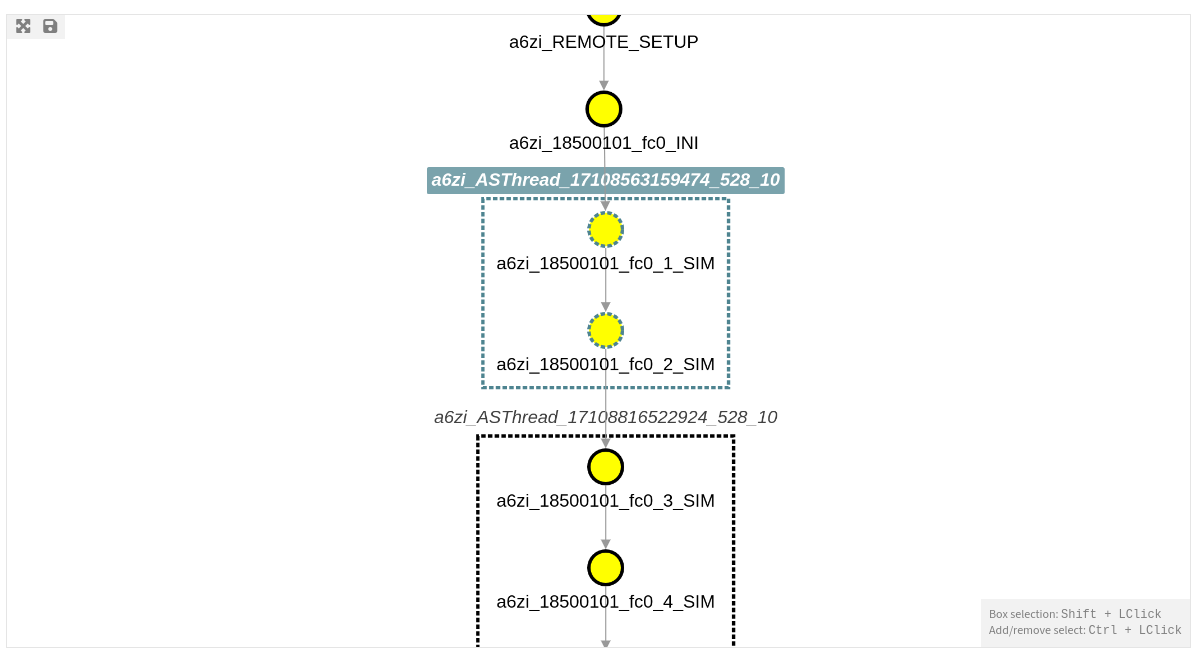
Graph Wrapper Representation#
If you want to select the nodes inside it you can do Shift or Ctrl plus Double Click the box.