Autosubmit GUI
Autosubmit GUI Main Page
Inside the Barcelona Supercomputing Internal Network you can find the latest version of Autosubmit GUI deployed for BSC users. It can be accessed by following the url http://bscesweb04.bsc.es/autosubmitapp/ or https://earth.bsc.es/autosubmitapp/. This is a graphic user interface that allows you to easily monitor your experiments and those of your colleagues. This Web App introduces many useful features for experiment monitoring, and we are continuously improving it.
Note
The Web App can also be accessed through the VPN Client provided by BSC.
When you enter the site, you will be presented with the following page:

11 Welcome page
Here you can search for any ongoing or past experiment by typing some text in the Search input box and pressing Search: the search engine will look for coincidences between your input string and any of the description, owner or name of the experiment fields. The results will be shown below ordered by status, experiments RUNNING will be shown in the first rows. You can also click on the Running button, and all the experiments that are currently running will be listed. The results will look like:

12 Search Result
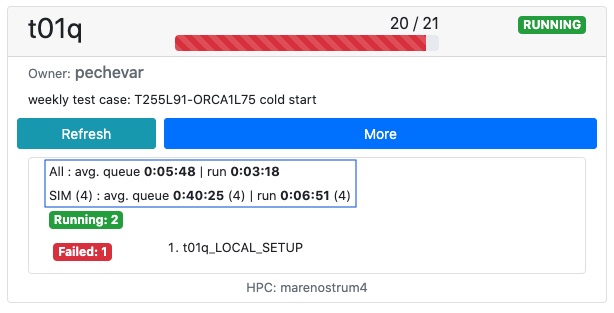
If you click on Show Detailed Data, summary data for each experiment (result) will be loaded. These are data details from the experiment run, useful to see its status at a glance. Progress bars and status will use different colors to highlight the important information.

13 Search Result plus Detailed Data
For each experiment, you see the following data:

14 Description of Detailed Data
Experiment Name
Progress Bar: Shows completed jobs / total jobs. It turns red when there are failed jobs in the experiment, but Show Detailed Data should have been requested.
Experiment Status: RUNNING or NOT RUNNING.
Owner
Experiment Description
Refresh button: It will say Summary when the detailed data has not been requested. If it says Summary and you click on it, it will load detailed data for that experiment, otherwise it will refresh the existing detailed data.
More button: Opens the Experiment Page.
Average Queue Time for all jobs.
Average Run Time for all jobs.
Number of Running Jobs
Number of Queuing Jobs
Number of Submitted Jobs
Number of Suspended Jobs
Number of Failed Jobs: If there are Failed jobs, a list of the names of those jobs will be displayed.

15 Average Times Feature
In experiments that include SIM jobs, you will also see the average queuing and running time for these jobs. In the latest version the time format has been updated to HH:mm:ss. The text for the SIM average follows the format avg. queue HH:mm:ss (M) | run HH:mm:ss (N) where M is the number of jobs considered for the avg. queue calculation and N is the number of jobs considered for run calculation.
After clicking on the MORE button, you will be presented with the Experiment Page, which is the main view that Autosubmit provides. These are its main components:
Important
To improve response times, Autosubmit GUI will try to store the dependency structure of your experiment in a database filed called structure_expid.db where expid is the name of your experiment. This file will be located in /esarchive/autosubmit/expid/pkl/.